First try (2000): Annotation
Lotus Notes story application
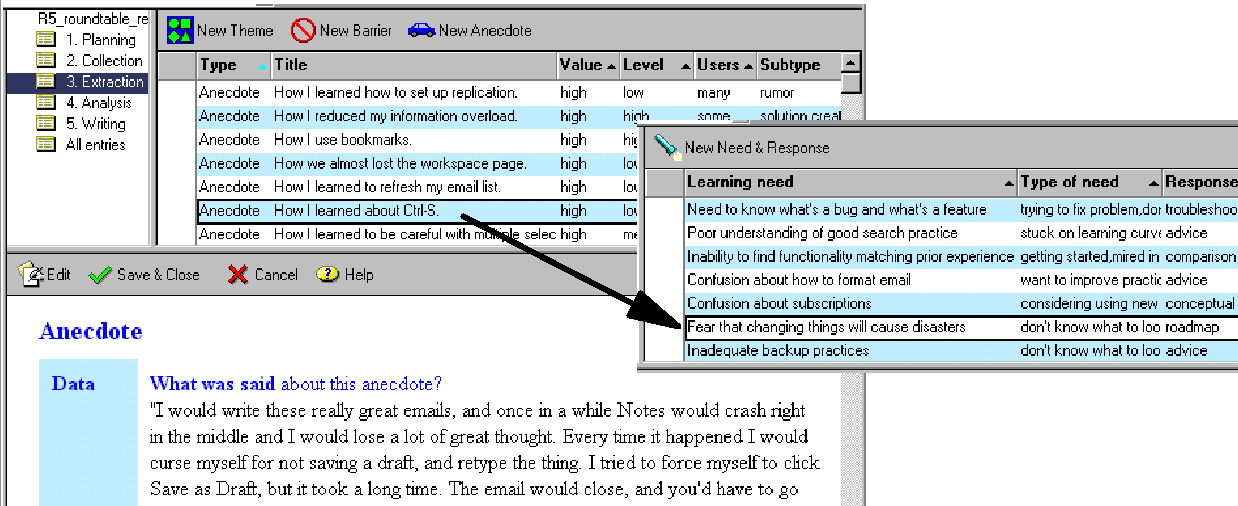
At IBM Research, in 2000, I used the database tools in Lotus Notes to create an unnamed system that asked questions about stories and compiled the answers into patterns I used to write reports for (internal) clients. This was essentially the genesis of participatory narrative inquiry.
I answered the questions myself, and I used the answers, along with annotations drawn from story texts, to create "observations" that I clustered into a "data model" that represented what the stories were saying. When I wrote this tool I was heavily into grounded theory, so it most closely resembles a qualitative research tool. But if you look closely at the screenshot you can see a hint of mixed methods, because I estimated the "prevalence" of each observation (e.g., where it says "Users" I have "many" or "some" and, as I recall, "few").
I used this tool on several research projects. At the end of my work at IBM Research, I wrote a 125-page document that described how to do the process we created. It was a lot like the book I ended up writing (and then improving) eight years later, except that IBM didn't give me permission to publish it (and that I learned a lot in the following eight years).
Second try (2001): Juxtaposition
Oral history database prototype
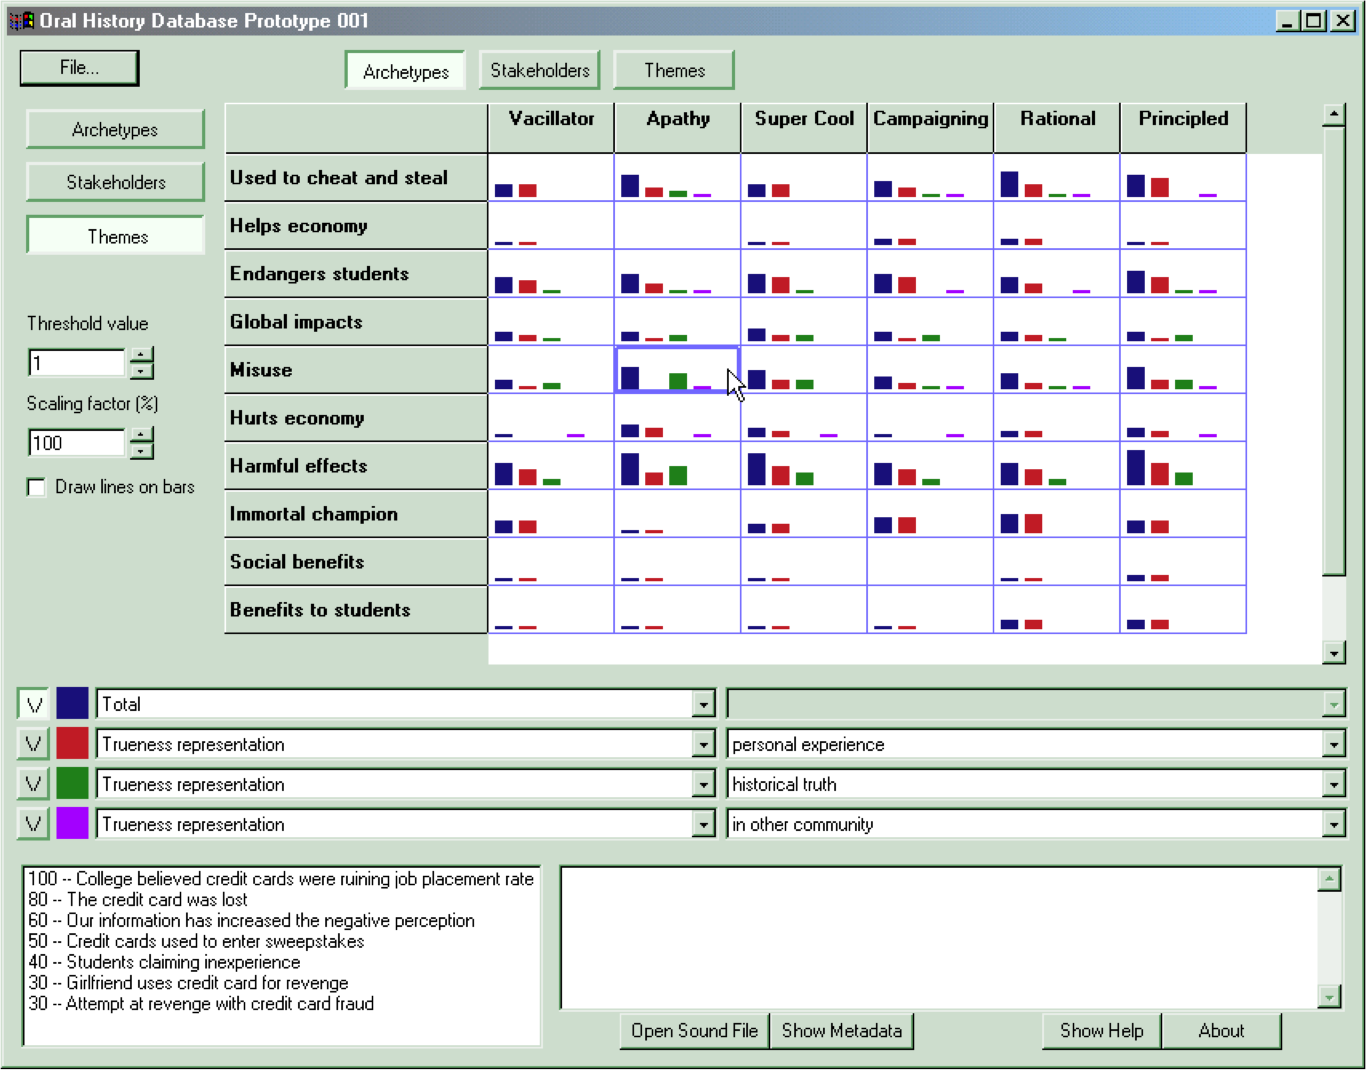
My second piece of software, which I called the "oral history database prototype," was also created for IBM. This time it was for the IBM Institute for Knowledge Management, for which I was a contractor for a few years. I created it soon after starting to work with Dave Snowden and Sharon Darwent of IBM Global Services on client projects.
The big advance in this project was in the juxtaposition of Dave's and Sharon's archetypes (which I now call story elements) with the questions I used in my earlier attempt.
This screenshot shows a translated version (topic and story titles changed, but patterns as we found them) of my first non-IBM story project, with something like 40 stories. I transcribed the stories and answered the questions myself. I'm not sure where the "archetypes, stakeholders, and themes" came from; I think the client might have created those in sensemaking sessions. I can still remember my surprise when I first saw the fascinating and useful patterns in these simple graphs. I saw fascinating and useful patterns in my earlier non-graphical software, of course, but seeing them in images made them "jump out" much more. I knew this was a good idea.
We used this software for something like twenty (I'm guessing here) projects over the next few years, and it slowly got more complicated.
Third try (2003): Visualization
One of the MNR prototypes
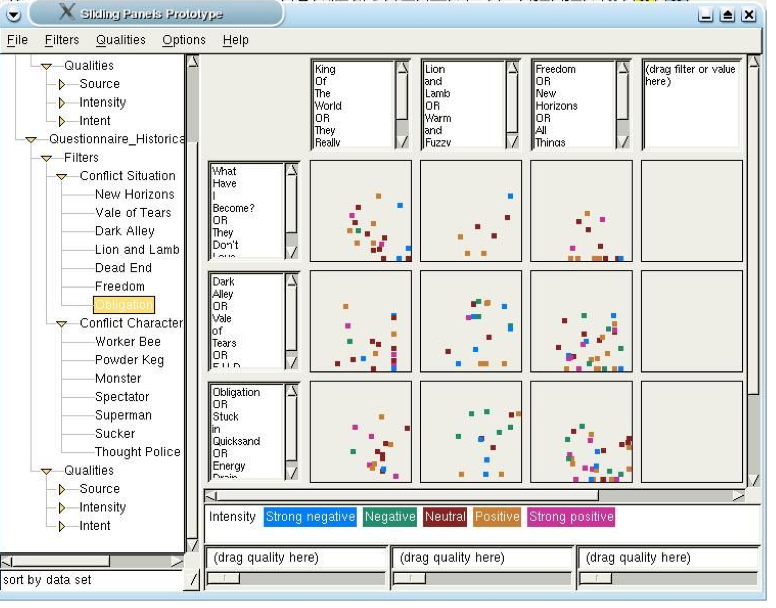
My third story-related software tool was created for the U.S. government, at the tail end of a three-year project helping analysts make sense of safety-related situations by listening to stories. For this research project, my mandate was to think about all the ways in which people could gain insights by looking at lots of stories together.
I started by reading through the literature on data visualization and choosing published approaches that looked promising. Then I created software prototypes to try out each idea with a data set (of stories and answers to questions about them). I called what I had created the "Mass Narrative Representation" (MNR) prototypes. They explored several different ways to show data about stories, from text-based descriptions to indicators on a line to points on a graph. (This is the report I wrote on the research project. It describes the design, creation, and testing of the MNR prototypes.)
Later I developed my MNR prototypes into SenseMaker Explorer. I kept improving (and using) this software until mid-2009.
Fourth try (2005): Collaboration
The Concept Demonstrator dashboard
My fourth attempt was a prototype collaborative software tool, built as a "concept demonstrator" for the Singapore government, as part of a three-year project to help people make sense of safety-related situations by listening to stories (the project was called RAHS). The prevailing feature of this software was its real-time collaboration for groups working together. My husband and I worked on it together.
In this project we learned a lot about what it would take to support groups of people working through story projects together on computers. The software was never used after it was demonstrated (for complicated internal reasons I never fully understood).
Fifth try (2006): Simulation
The social network simulator
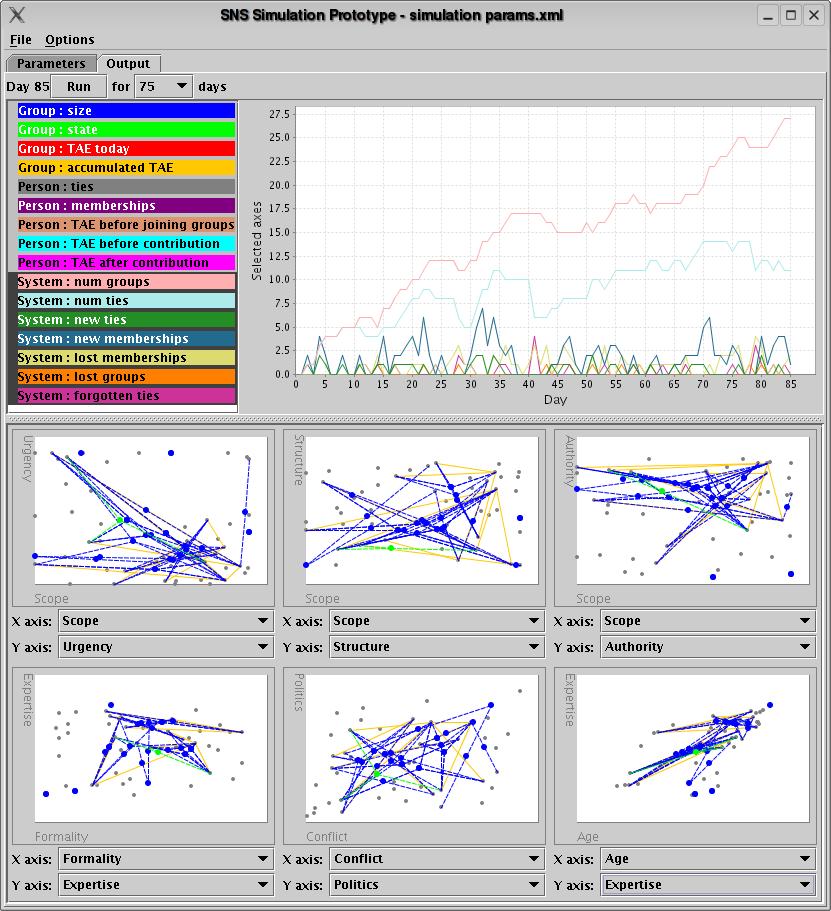
Another research project I did in the RAHS years was to look into simulation of network activity, to consider new ways to help analysts make sense of networks (particularly of terrorists).
I called the resulting prototype SN_Sim. Its purpose was to help groups of people think through situations by playing with conditions of connectivity to see how the simulated network responded.
I built the simulation based on the concepts of homophily and Blau space, which are ways of connecting people other than with simple "I know you, you know me" relationships. (I wrote a white paper about this project.)
In this project, I learned even more about writing software that helps people make sense of complex-and-complicated patterns by creating things they can look at and play with.
Sixth try (2007): Collection
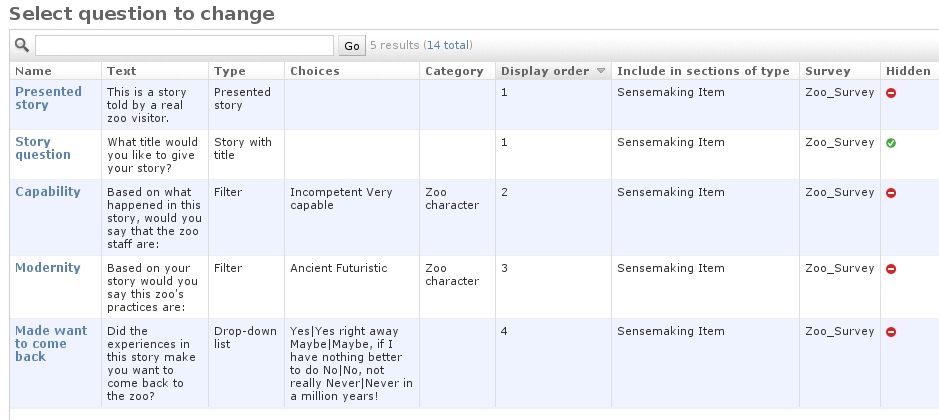
An early screen from SenseMaker Collector
Also as part of my/our work on RAHS, my husband and I built and maintained the first three versions of SenseMaker Collector, a system people used to gather stories over the internet.
I based much of the design on what I'd seen used in existing survey software such as SurveyMonkey (I believe I looked at other systems as well, but I can't recall what they were now). I added features that made sense for asking people to tell stories, and for asking people questions about their stories.
This was the first time I designed software to be used for collecting (rather than working with) stories.
Seventh try (2007): Construction
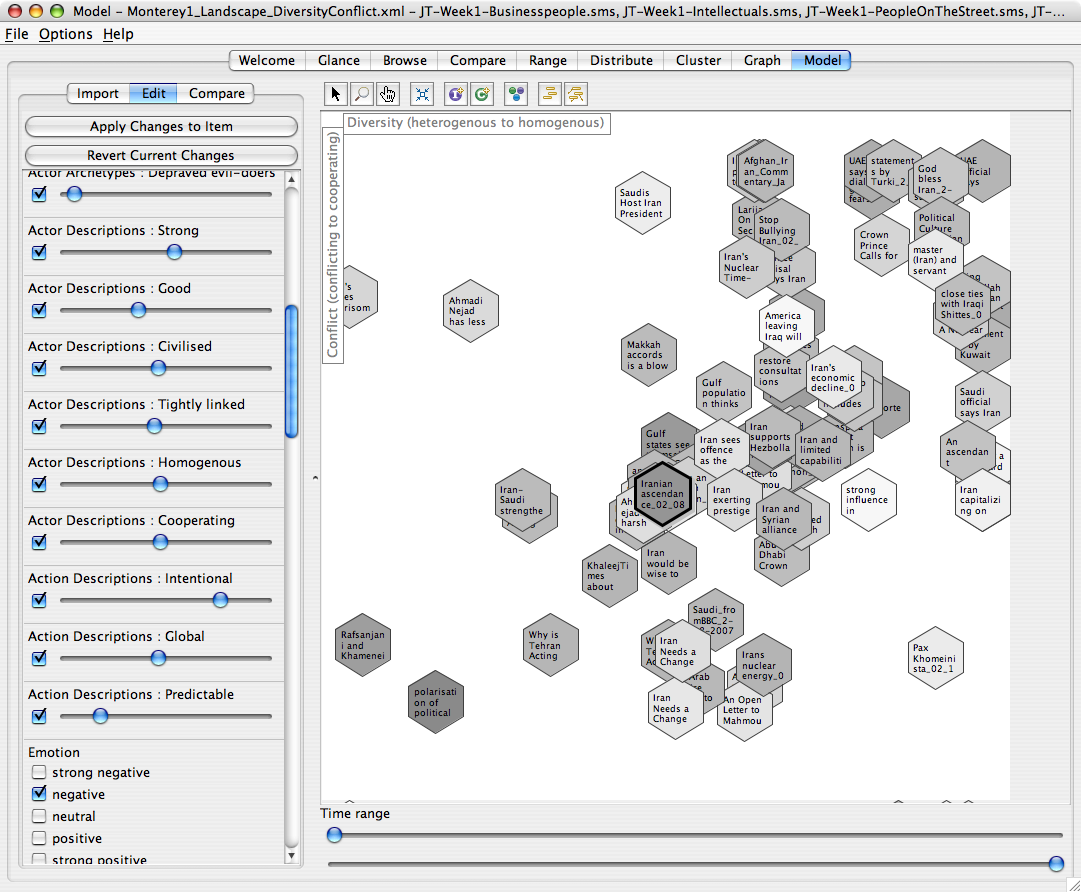
A Modeler landscape
This is the last RAHS story, I promise. I was asked to create prototype software to help people create sensemaking constructs -- models -- together. The result was SenseMaker Modeler. You could use it to do most of the sensemaking exercises we had created (timelines, landscapes, story elements, story construction) using software.
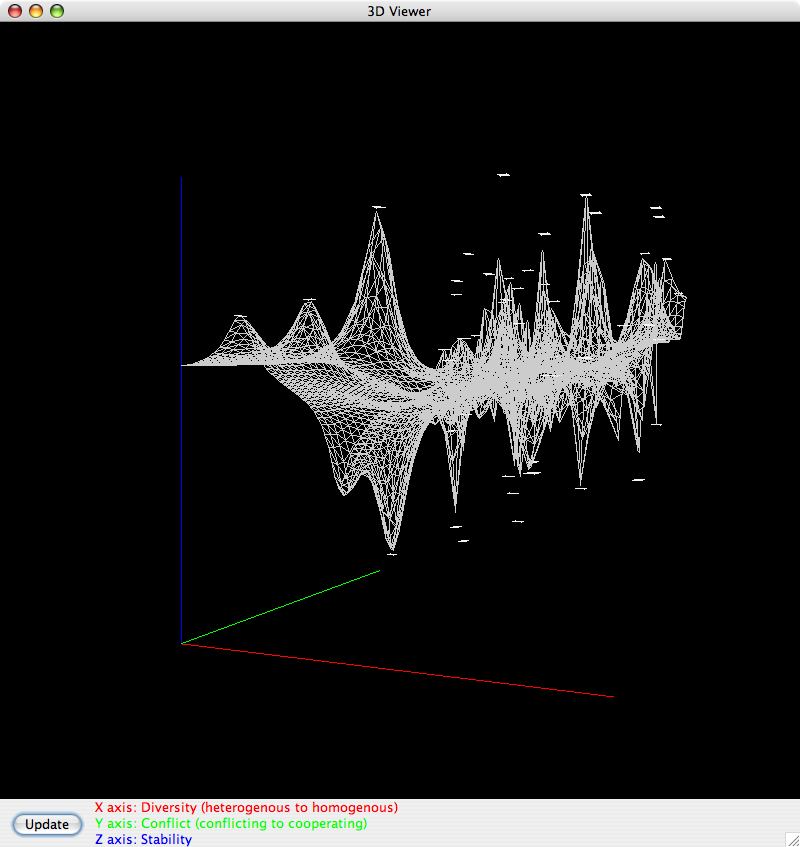
A Modeler landscape (3D view)
I don't remember Modeler having real-time multi-user elements. As I recall, people were meant to work on models with one person interacting with the software while others simply watched their screen. I would have liked to have made it multi-user if I had had more time to work on the project, but it was only one research project of many within the umbrella of that work.
Modeler was used on a few projects, but not many. I can't remember why.
Eighth try (2008): Story sharing

Looking for patterns in Rakontu
By 2008 my husband and I had saved up a little money, so I decided to take a few months off and do something I had wanted to do since 1999. I wanted to help people share stories in groups.
The result was Rakontu. I meant Rakontu to be working software, but it turned out more as a research project. This was partly because I didn't have a lot of time to work on it, and partly because I built it on top of the Google App Engine, which was not as reliable or stable a platform as I thought it would be.
I still think the ideas in Rakontu are valid, and people still keep telling me they are interested in the ideas, but the world is so saturated with social media ideas (and people looking for money for social media ideas) that I haven't been able to get funding to continue work on Rakontu. Maybe someday I'll get back to it.
Rakontu was in active use for about four months. We had about forty people signed up, but most of the actual day-to-day use of the software was between myself and John Caddell. I'm glad I worked on Rakontu. I learned a lot about building collaborative on-line story software.
Ninth try (2009): Catalysis
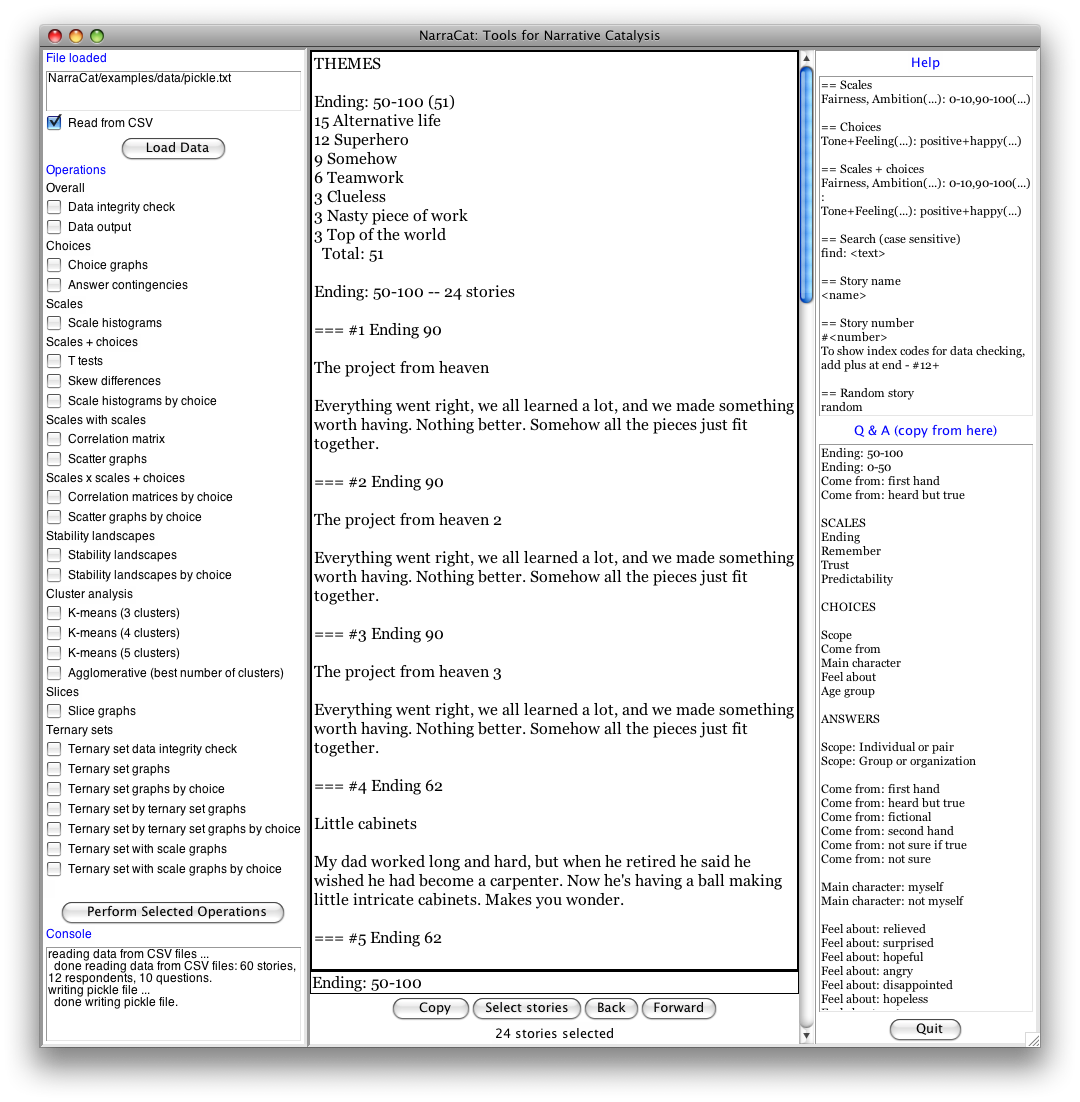
The NarraCat browser
After I stopped working on SenseMaker, I wanted to create a new version of software to use for my catalysis work for clients. The result was NarraCat.
In making NarraCat I made a pretty major departure from all of my previous attempts (except maybe the first one). It was this. When I used Sensemaker Explorer to create catalysis reports for clients, I found that I needed to work systematically through the patterns that appeared. I couldn't just hop around in the data, choosing patterns I liked, because I was considering the data for other people. I needed to work my way carefully through every possible connection. So I kept adding more and more reports to Explorer; using the reports almost exclusively; and ignoring the dynamic response system I had built earlier (which is useful in group sensemaking but not in catalysis).
Thus, when I decided to write new software to use in client projects, I wanted it to be all about the reporting. So I created a simple interface that spits out hundreds or thousands of graphs to file directories. I used NarraCat on all of my client projects from 2009 to mid-2017. NarraCat became an old and trusted friend: capable, reliable, and easy to tinker with.
So why did I abandon NarraCat? Because I was the only one who found it easy to use. In the several years it was available, only a few people told me they had used it successfully. In fact, more people told me they tried to use NarraCat and failed. It was just too complicated and messy for non-programmers.
I felt sad about that fact for years. I made a few attempts to "package" NarraCat so a non-programmer could use it more easily, but I kept running into snags related to Python and the matplotlib library. Eventually I realized that I would have to rewrite NarraCat from scratch using some other system. That feeling of wanting to help a wider range of people led to the development of NarraFirma.
Not exactly my software (1998): StoryHarp
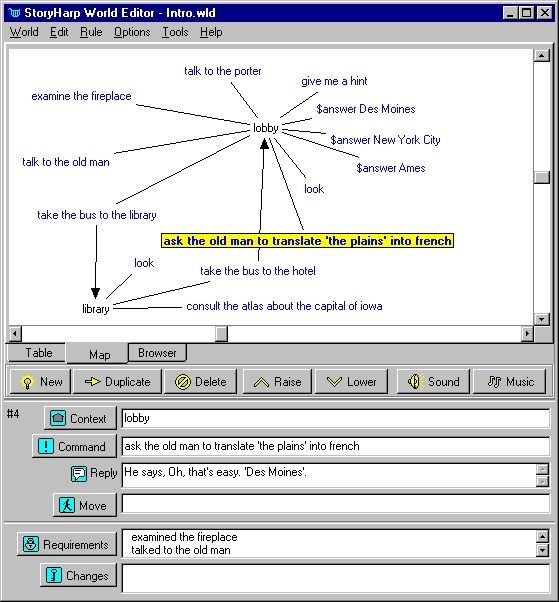
The StoryHarp Audioventure System
Before I ever heard of organizational and community narrative, my husband and I wrote a series of educational software titles. One of them was an interactive fiction editor for text or audio choose-your-own-adventure stories. It was called StoryHarp.
StoryHarp was entirely Paul's idea, but I helped with some of the GUI design, help system, and examples. (You can read one of my example interactive stories, "House and Yard," on the StoryHarp web site.)
It just goes to show that I was thinking about stories before I ever thought about stories.